
The Cookbook Profiling Tool provides a small library that can be bundled with a BD-J application to provide execution-time profiling. Execution-time profiling is an extremely valuable technique for developing fast, well-optimized software. The BD-J environment presents a challenge, because meaningful performance measurements must be made on commercial hardware. BD-J application developers rarely have access to VM-level debugging tools, such as execution time profiling tools, on such players. Further, the resolution of the system clock available to applications on BD players is not very good - no more than 1ms, and often 10ms or more. This limits the usefulness of direct application-level measurement.
We have addressed these limitations by creating a profiling framework that
generates UDP packets on the BD player and sends them to a PC. When
the packet is received, software on the PC timestamps the packet using
the higher-resolution clock offered by System.nanoTime(), which
was found to have a resolution no worse than 1µs. We've had very
good results collecting measurements with this tool. We recommend running
it on a quiet LAN, with wired connections directly to the router for the
player and the PC.
To profile an xlet, the xlet's JAR
just needs to be built with the PROFILE flag of
com.hdcookbook.grin.util.Debug set true, and
it must include calls to the profiling facility in
com.hdcookbook.grin.util.Profile. Profiling timers
are already built into key parts of the GRIN animation framework
and the setup manager, but a developer may wish to add more where
needed. We've found that 150 timer executions per second is fine, but
that thousands of timer executions per second becomes disruptive to the
xlet under test.
Below is a graphical timeline of a 23 second long run of the GrinBunny
game, produced by a crude prototype visualization tool in
AuthoringTools/profiler. By the time you read this, a
more sophisticated visualization tool may well be available; check in
that directory, and run the tool against the profiling data in
sample_profile.dat, which is illustrated here.
Below we see a screen capture that shows the entire run:
	    Data runs from 0ms to 23068ms.
	    Displaying from 0ms to 23068ms.

		0 - blue       advanceModel(DD engine 0)
		1 - cyan       damageCalculation(DD engine 0)
		2 - green      eraseBuffer(DD engine 0)
		3 - magenta    drawToBuffer(DD engine 0)
		4 - orange     blitToFB(DD engine 1)
		5 - pink       idleWait(DD engine 0)
It's hard to make much of this data without zooming in, but we
can already see some interesting things. The blue
advanceModel() bar shows the director's Java
scripting code that contains the game logic, and we can see thin
vertical bands where it runs for each frame. Cyan represents
the optimized drawing calculation done by the GRIN scene graph,
and green the time spent erasing the buffer used for double-buffering.
Magenta is the time spent drawing to that buffer, and orange the time
spent copying that buffer to the player's framebuffer. Finally,
pink represents the time the thread sleeps, waiting for the next
frame to be drawn.
A block of time is displayed with a minimum thickness of one pixel,
so we can't make much of the density of the lines, but we can already
see that the bulk of the execution time seems to be spent in
idleWait() (pink), which is good. This shows that we're
not stressing the player, or falling behind.
We can also see notations along the top, like D_0 and
D_1. These are debugging messages that are sent as UDP
packets to the PC collecting data, where the left edge of the D
aligns with the timestamp of the message. These messages are byte arrays,
but they can contain characters, so the visualization tools prints them out
in hex dump format:
    p0
    00000000:  54 75 72 74 6c 65 20 68  69 74 2c 20 73 63 6f 72   Turtle hit, scor
    00000010:  65 20 6e 6f 77 20 30 30  30 35 30                  e now 00050

    p1
    00000000:  53 61 75 63 65 72 20 68  69 74 2c 20 73 63 6f 72   Saucer hit, scor
    00000010:  65 20 6e 6f 77 20 30 30  34 30 30                  e now 00400

    p2
    00000000:  54 75 72 74 6c 65 20 68  69 74 2c 20 73 63 6f 72   Turtle hit, scor
    00000010:  65 20 6e 6f 77 20 30 30  34 35 30                  e now 00450
Zooming into a 400ms section of the graph, things get more interesting:
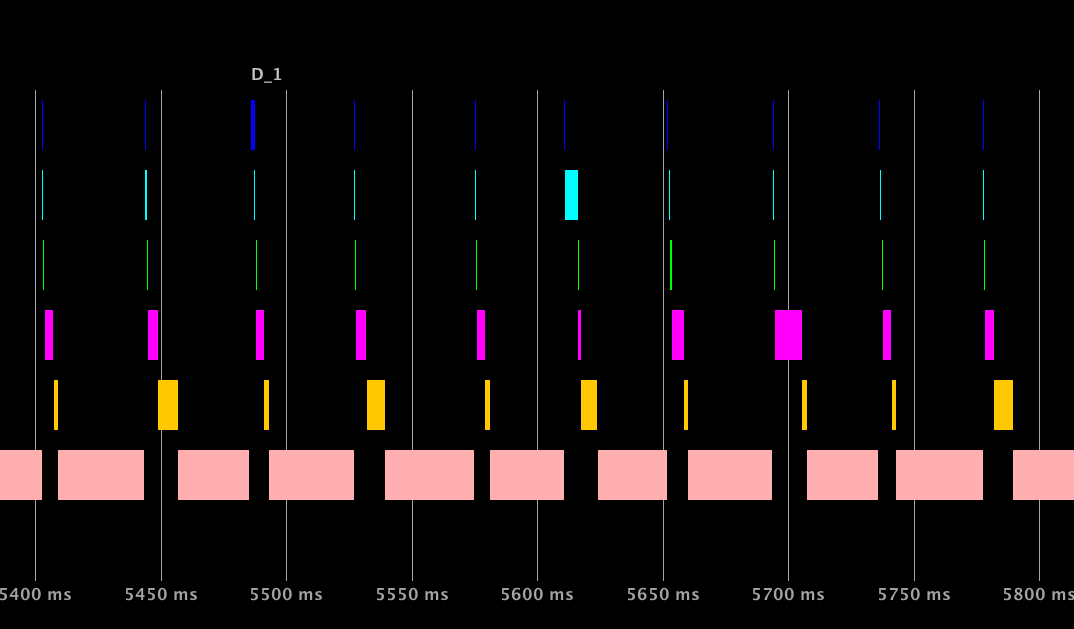
	    Data runs from 0ms to 23068ms.
	    Displaying from 5400ms to 5800ms.

		0 - blue       advanceModel(DD engine 0)
		1 - cyan       damageCalculation(DD engine 0)
		2 - green      eraseBuffer(DD engine 0)
		3 - magenta    drawToBuffer(DD engine 0)
		4 - orange     blitToFB(DD engine 1)
		5 - pink       idleWait(DD engine 0)
Here, we can clearly see that the majority of the execution time is,
indeed, being spent waiting for it to be time for the next frame. The
GrinBunny game isn't very demanding, but we should also point out that
this profiling data was collected on a very fast player, and it may not
be representative of a typical consumer player. However, even on a
slower player, we expect that a good percentage of GrinBunny's
time would be spent in idleWait().
Another interesting data point is the time spent calculating the optimized
drawing areas, shown in the cyan damageCalculation() bar.
This process is normally very fast, but you can see that there's an
anomalous reading at approximately 5.6 seconds (in the middle of the
plot). This might just be a short generational GC run, contention
with other network traffic on the LAN where the test was run, or some
other transient problem unrelated to the BD-J application. However, if a
pattern of such occurrences could be established, this might indicate an
area for further work.
Another interesting observation is that the green eraseBuffer()
bars are consistently much narrower than the magenta
drawToBuffer() bars. This is despite the fact that erasing
the buffer touches more pixels than drawing the various images into the
buffer. The latter involves more draw operations, so this confirms that
on modern hardware, drawing time is frequently more sensitive to the number
of drawing operations than it is to the number of pixels touched.
Of course, it must be remembered that the time when a method call completes
is not necessarily when the hardware finishes the operation in question, so
these conclusions should not be viewed as absolute.
Using this profiling framework based on UDP packets, you can gain valuable insights into the performance of a BD-J xlet. Sending UDP packets that are timestamped on reception with a PC's high-resolution system clock has yielded good data that has helped to understand the performance of production BD-J software. Further, our measurements indicate that the GRIN animation framework and scene graph have performed as expected, adding little discernible overhead to the time spent doing double-buffered direct draw.
We hope that this flexible, application level profiling framework is found to be useful.